Today, I am having fun following with this tutorial . It’s with lot of fun playing these services.
🗺Big Picture
There are a lot of details about Azure Synapse Analytics. I would simplify this subject as “you can use this service to”:
- get the data from somewhere and store it in your cloud storage
- extract the data
- use a notebook/SQL to run some analysis task on the data That’s it. Fairly simple.
🔭Overview
RemarkI follow this tutorial and this script to provision all the services.
Sometime, we can easily get lost in the tedious details during configuring/provisioning a service. Therefore, at the beginning, I would start with a big picture on Azure Synapse Analytics for novice like me. Here’s all the relevant subjects:
 From top to bottom and left to right, we have:
- Azure subscription: This is your passport to the world of Azure.📄
- resource group: Think of this as your toolbox where each tool can cost you money. 💸
- Apache Spark pool: Imagine this as a team of hardworking bees that are excellent at handling and processing large amounts of data.🐝
- storage account: This is like a safe deposit box where you store all your valuable data. 🗝️
- dedicated SQL pools: Picture this as a fleet of powerful engines that can handle complex SQL queries and data processing tasks. 🚀
- Azure Synapse Analytics Workspace: This is your playground where you can experiment and play with all your tools. 🎡
- resource group: Think of this as your toolbox where each tool can cost you money. 💸
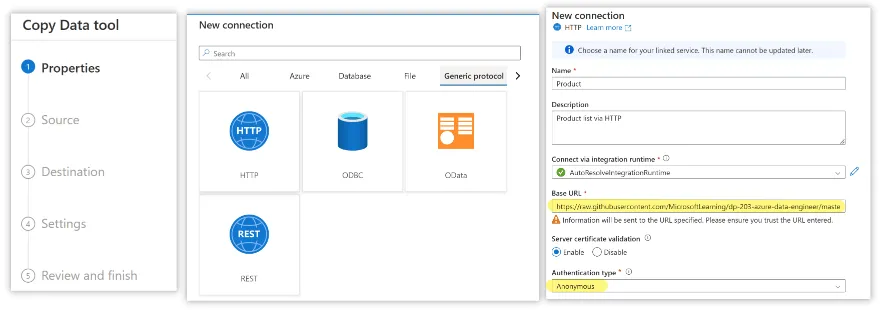
1️⃣ Download Data
The key takeaway of this step is that you can create a pipeline in Synapse via HTTP request method(of course there other types of connection). 
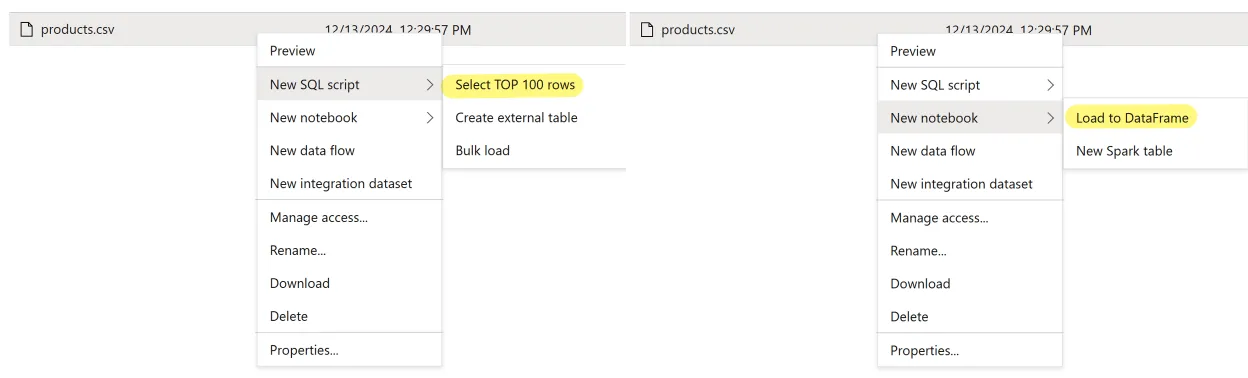
 Once the data is downloaded. You can navigate to
 Data tab exploring it.
TipThe significant stuff here is that you can automate the “download data” into a pipeline storing in cloud container. This is very different from I normally do. Download some data into my desktop and play with it.
Simply put, what Azure provides is a sequence of services scaling the one-person-working environment into DataOps and MLOps.
2️⃣ Analyze Data
The cool thing is, you can play with the data right away!
 Writing some Python snippet
%%pyspark
df = spark.read.load('abfss://files@datalakexxxxxxx.dfs.core.windows.net/product_data/products.csv', format='csv'
## If header exists uncomment line below
##, header=True
)
display(df.limit(10))and SQL query.
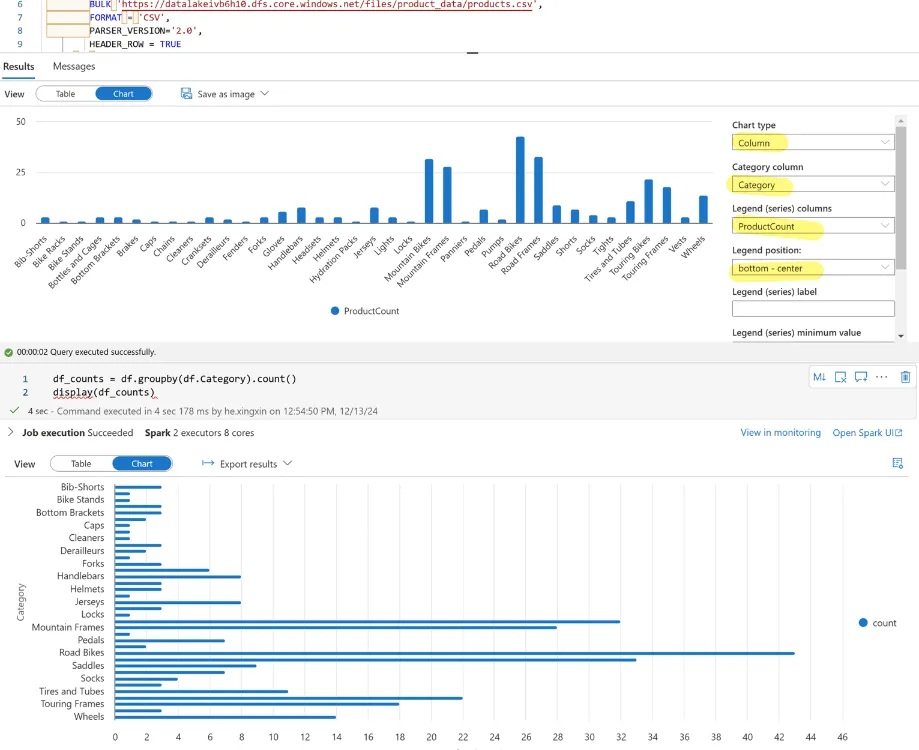
SELECT
Category, COUNT(*) AS ProductCount
FROM
OPENROWSET(
BULK 'https://datalakexxxxxxx.dfs.core.windows.net/files/product_data/products.csv',
FORMAT = 'CSV',
PARSER_VERSION='2.0',
HEADER_ROW = TRUE
) AS [result]
GROUP BY Category;That’s really cool. The result can visualized right away! No need to use matplotlib.