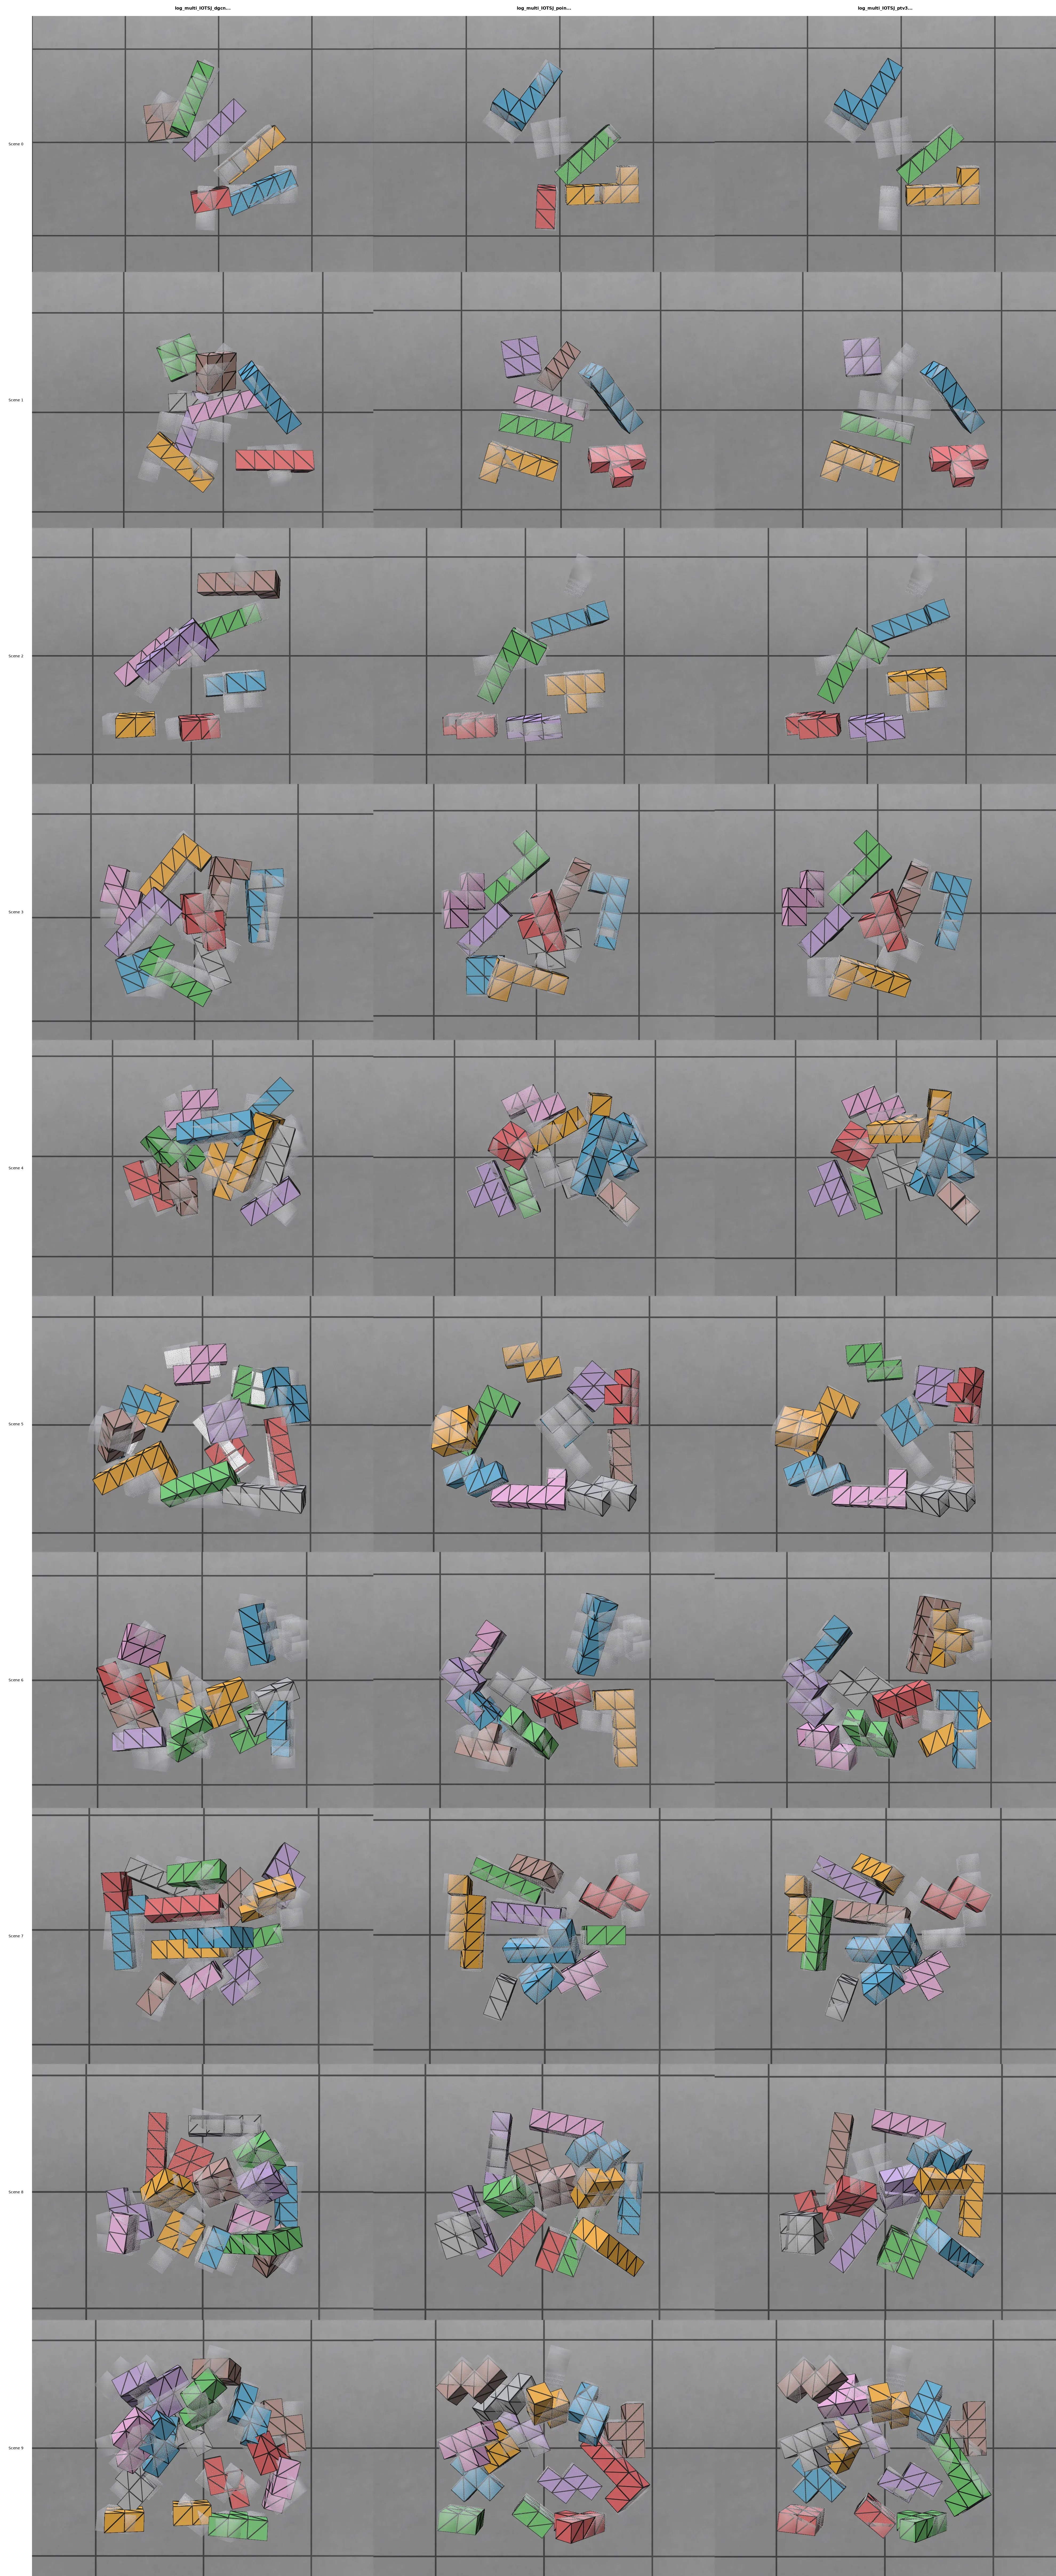
This week, I made significant progress on my 6D pose estimation for my 3D Tetris project. The results were fascinating! Below is a comparison matrix of inference results on the evaluation dataset, where the rows represent the scene and the columns represent the backbone architecture.

I was quite surprised by the results of 📄Dynamic Graph CNN for Learning on Point Clouds as it performs very well in the “packing” scenario (where 3D tetromino pieces are laid flat on a table), but it struggles significantly in the “bin stacking” scenario. On the other hand, using 📄PointNet++: Deep Hierarchical Feature Learning on Point Sets in a Metric Space and 📄Point Transformer V3: Simpler, Faster, Stronger as backbones demonstrated much more promising results.
However, there is still a performance gap for objects whose symmetry group has non-zero cardinal number.
Simply put, the symmetry group refers to the set of rotations under which an object remains visually unchanged. An easy example is the cube , which has 24 rotations in its symmetry group according to this website.
In my case, the tetrominoes “O” and “I” possess the largest symmetry groups, containing 8 rotations each.
Before moving further, I plan to double-check if my model performs well in a real-world environment to assess the sim-to-real gap.
Transformer
At first, the performance of my 📄Point Transformer V3: Simpler, Faster, Stronger was underwhelming. It produced very poor inference results on the evaluation dataset.
I almost started to question the viability of this approach. However, seeing so many papers successfully use it as a backbone, I decided to debug it further. After inspecting the logs of losses, I noticed a huge discrepancy between the training set and evaluation set.
I realize my model was overfitting. I took a step back to research transformers and found out that they are “data-hungry” beasts. The dataset I am using is relatively small, containing only about 10k samples.
To address this, I scaled down the default parameters in 📄Point Transformer V3: Simpler, Faster, Stronger from this:
backbone = dict(
backbone_name='ptv3',
# Encoder architecture
enc_depths=(2, 2, 2, 6, 2),
enc_channels=(32, 64, 128, 256, 512),
enc_num_head=(2, 4, 8, 16, 32),
enc_patch_size=(1024, 1024, 1024, 1024, 1024),
# Decoder architecture
dec_depths=(2, 2, 2, 2),
dec_channels=(64, 64, 128, 256),
dec_num_head=(4, 4, 8, 16),
dec_patch_size=(1024, 1024, 1024, 1024),
)…to this:
backbone = dict(
backbone_name='ptv3',
# REDUCED
enc_depths=(1, 1, 1, 4, 1),
enc_channels=(32, 64, 128, 256, 512),
enc_num_head=(2, 4, 8, 16, 32),
enc_patch_size=(1024, 1024, 1024, 1024, 1024),
# REDUCED
dec_depths=(1, 1, 1, 1),
dec_channels=(64, 64, 128, 256),
dec_num_head=(4, 4, 8, 16),
dec_patch_size=(1024, 1024, 1024, 1024),
# INCREASED: Regularization
drop_path=0.5, # Increased from 0.3
attn_drop=0.1, # Added attention dropout
proj_drop=0.1, # Added projection dropout
)
I intentionally increased the dropout to prevent overfitting, and it works!
The following is my weekly reflection.
GPU Usage
Another big lesson learned this week was on inspecting GPU usage. At first, I thought the slow training speed was due to the transformer architecture. It turned out I was wrong. One day, out of curiosity, I checked if the model was fully utilizing my GPU memory and found something interesting:
319 MiB
319 MiB
319 MiB
...
The GPU memory usage stayed low like this for over 15 minutes. I only discovered this bottleneck, thanks to the following command, until I added to my sbatch script:
nvidia-smi --query-gpu=timestamp,name,utilization.gpu,utilization.memory,memory.used,memory.total --format=csv -l 10 > gpu_monitor_${SLURM_JOB_ID}.csv &
GPU_MONITOR_PID=$!Without this, I might never have noticed the issue! It turned out that there was a flaw in the dataset loading strategy.
with open h5 file:
# do some very heavy data processingThe I/O was blocking the workers, preventing them from reading data until the processing finished. To fix this, I moved the heavy “read + process” logic into __getitem__(self, idx) (see PyTorch tutorial ), leaving the initialization step to handle only file paths. My wait time dropped from 15 minutes to 2 minutes!